Torpedo Bat Exit Velocity: What the Lab Data, Simulations, and Statcast Numbers Actually Show
Exit velocity is the single most important measurable output of a baseball swing. It captures the combined result of bat speed, contact quality, and the physics of the bat-ball collision in one number. When researchers, analysts, and players want to know whether the torpedo bat actually works, exit velocity is where they look first.
This page presents the complete exit velocity evidence for the torpedo bat across three distinct data sources: physics simulation (Alan Nathan's FanGraphs model), laboratory barrel mapping (Baseball Performance Lab), and real-world Statcast data (the 5-Yankees study and the broader 18-player analysis). Each source has different methodological strengths. Together they give a complete, multi-layered picture of where the torpedo bat wins, where it loses, and by how much.
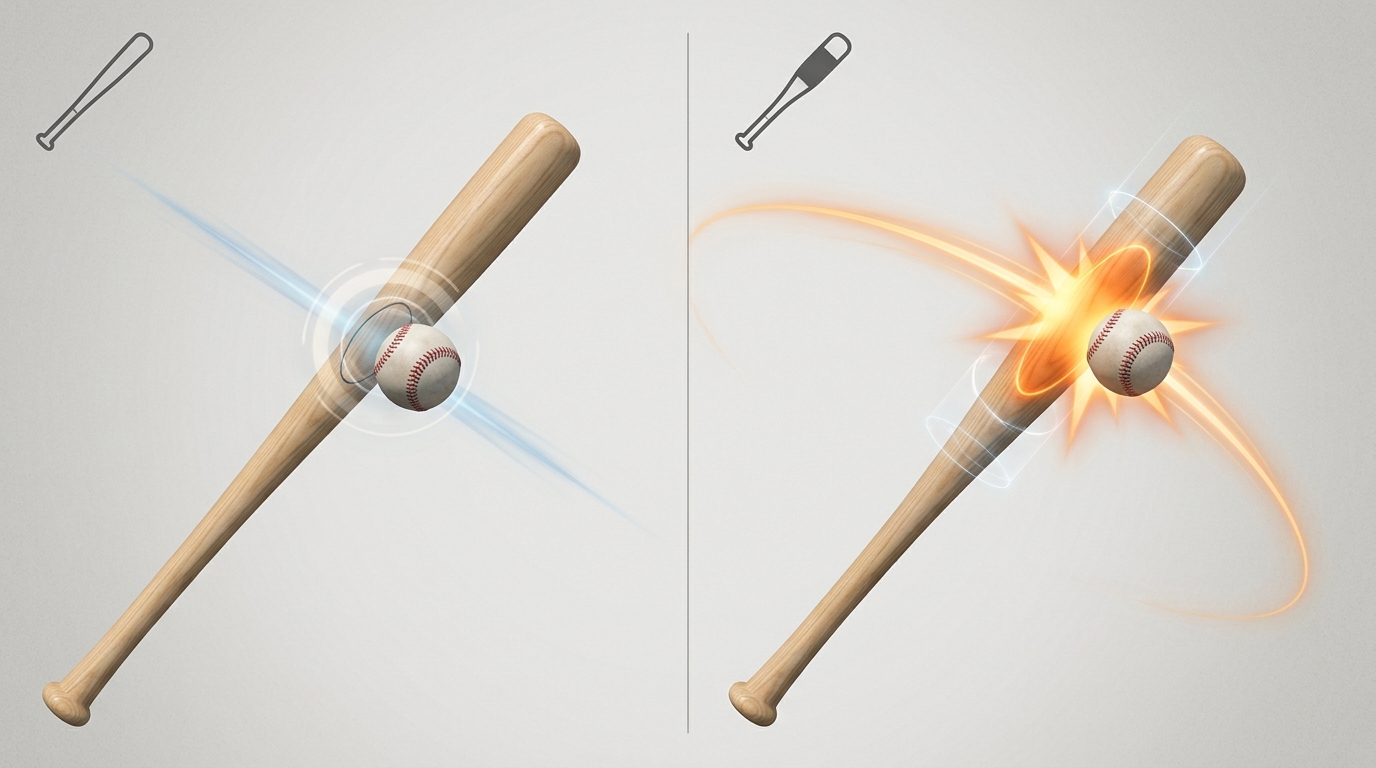
The torpedo bat does not uniformly improve exit velocity across the entire barrel. It improves EV at the contact zone by 5–7% and reduces it at the tip by 2–3%. Understanding which zone a player contacts most frequently is the entire exit velocity question.
Exit Velocity Numbers at a Glance
Lab EV Gain at Contact Zone
+5–7% vs. traditional Baseball Performance Lab barrel map — torpedo outperforms at 5–8" from tipLab EV Loss at Barrel Tip
-2–3% vs. traditional Nathan simulation — traditional bat outperforms torpedo at 0–3" from tip18-Player Statcast Average Gain
+0.48 mph Sportscasting.com analysis — 61% of users improved (2024 vs. 2025)Best Individual Gain (Volpe)
+3.3 mph average EV 2024 to 2025 year-over-year; hard-hit rate 35% → 48%EV-to-Bat-Speed Multiplier
1.2 mph EV per 1 mph bat speed Marquee Sports Network / established physics constant — key cascade effectSource 1: Alan Nathan's Physics Simulation (FanGraphs, April 2025)
The most rigorous available analysis of torpedo bat exit velocity comes from Alan Nathan, Professor Emeritus of Physics at the University of Illinois and the foremost researcher on the physics of the ball-bat collision. Nathan published his findings on FanGraphs in April 2025 after obtaining actual diameter profiles of both a conventional and torpedo bat used by the same MLB player — giving him real-world geometry to run through his collision simulation.
The Simulation Setup
Nathan's ball-bat collision code — developed over decades of peer-reviewed research and published in the American Journal of Physics — calculates exit velocity as a function of contact location along the barrel. The key equation governing the result is:
Where q = collision efficiency — a function of bat mass distribution, contact location, and bat stiffness at that point
By inputting the exact diameter profiles of both bats — measured point by point along the barrel — Nathan's simulation calculates how collision efficiency (q) and effective bat mass vary with contact location, then translates both into an exit velocity curve for each bat.
What the Simulation Found
Nathan's EV simulation produced a clear, position-dependent result: the torpedo bat's EV curve crosses the traditional bat's EV curve at a point approximately 5–6 inches from the tip. Inside that crossing point (closer to the tip), the traditional bat produces higher EV. Outside it (further from the tip, toward the handle), the torpedo bat produces higher EV. The peak advantage for the torpedo sits at the 6–8 inch zone — the modal MLB contact location — where the torpedo's mass concentration is greatest.
Nathan's most significant finding beyond the EV curves: the torpedo bat's sweet spot width is greater than the traditional bat's. The zone of high collision efficiency — where EV is near its peak — is broader on the torpedo design. This was described by Nathan as a "non-trivial result" that depends on higher-order vibrational modes, and one that provides a definite advantage for the torpedo design independent of the contact-zone EV gain.
— Alan Nathan, 2025 Saberseminar presentation
Source 2: Baseball Performance Lab Barrel Map
The Baseball Performance Lab (BPL) provided the most practically accessible visualization of the torpedo bat's exit velocity profile — a barrel map showing EV output at each location along the barrel, directly compared between a torpedo and traditional bat design.
What a Barrel Map Shows
A barrel map is a positional EV visualization: for each inch-by-inch location along the barrel, it shows the expected exit velocity for a contact event at that spot, holding bat speed and pitch speed constant. It is the closest available approximation of a laboratory measurement of bat performance without an actual air-cannon test.
The BPL Barrel Map Findings
The BPL barrel map for the torpedo bat showed: 5–7% more power at the contact zone (the 5–8 inch region from the tip) compared to a traditional bat at the same location, and 2–3% less power at the very tip (0–3 inches). The map visually demonstrates the EV crossover that Nathan's simulation predicted — a literal color shift from the traditional bat's hot zone near the tip to the torpedo's hot zone at the contact zone.
The BPL findings are particularly compelling because they are empirically grounded in bat geometry rather than purely computational — the barrel map incorporates real physical bat profiles and the known relationship between bat mass, diameter, and collision efficiency at each location. Alan Nathan's own website specifically links to the BPL explainer as recommended viewing alongside his FanGraphs analysis.
The BPL barrel map is the most intuitive visualization of torpedo bat performance available. It shows exactly where the torpedo bat outperforms and underperforms a traditional bat, in color, at every contact point along the barrel.
EV Zone-by-Zone: Where Torpedo Wins and Loses
| Barrel Zone | Distance from Tip | Traditional EV | Torpedo EV | Verdict |
|---|---|---|---|---|
| End tip zone | 0–3" | Higher — max mass at tip | Lower — narrowed, less mass | ❌ Torpedo loses here |
| Transition zone | 3–5" | Moderate EV | Rising toward peak | ≈ Approximately equal |
| Contact zone (sweet spot) | 5–8" — modal MLB contact | Good — but not peak mass | Highest EV — 5–7% gain | ✅ Torpedo wins decisively |
| Inner barrel zone | 8–12" | Declining EV | Moderate — taper transition | ≈ Approximately equal |
| Handle zone | 12"+ from tip | Low — poor contact zone | Low — same as traditional | Both low — zone rarely contacted |
The decisive row in this table: Contact Zone (5–8") — where the torpedo produces its 5–7% EV gain. This is the zone where most MLB players make contact most of the time. DRaysBay's analysis of Statcast contact data found that the modal MLB contact location is 4–6 inches from the tip, with significant clustering extending to 8 inches. For the large majority of MLB hitters, the torpedo's peak mass zone overlaps with their natural contact zone — which is why 61% of users in the 18-player study showed EV gains rather than losses.
How Collision Efficiency Determines Exit Velocity
Understanding why the torpedo bat's contact zone produces higher EV requires understanding the collision efficiency term (q) in Nathan's exit velocity formula. This is the most direct connection between bat mass distribution and the EV numbers.
Collision efficiency (q) is the ratio that describes how much kinetic energy is transferred from the bat to the ball at the moment of contact. It depends on: (1) the effective bat mass at the contact point — more mass behind the ball = higher q; (2) the bat's structural vibration response — contacts near vibration nodes produce less energy loss to bat vibration = higher q; and (3) the coefficient of restitution of the ball-bat system — how bouncy the contact is.
The torpedo bat improves collision efficiency at the contact zone on two fronts simultaneously: it places more mass there (higher effective bat mass), and it shifts the vibration nodes toward the contact zone (less energy lost to bat vibration). Both effects raise q at the contact zone. At the tip, both effects reverse — less mass and nodes further away — lowering q there.
| Factor in EV Formula | Symbol | Traditional Bat | Torpedo Bat | Net Effect |
|---|---|---|---|---|
| Pitch speed | v_pitch | Same (90–95 mph avg) | Same | No change |
| Bat speed at contact | v_bat | Baseline | ↑ ~1–3 mph (MOI reduction) | Torpedo advantage |
| Collision efficiency (q) | q | ~0.20 at contact zone | ↑ at contact zone (mass gain) | Torpedo advantage |
| Collision efficiency (q) at tip | q_tip | ~0.20 (traditional strong) | ↓ at tip (mass loss) | Traditional advantage at tip |
| Effective bat mass | m_eff | Higher at tip | Higher at contact zone | Zone-dependent tradeoff |
| Net EV at contact zone | EV_contact | Baseline | +5–7% (BPL barrel map) | Torpedo clear winner |
Source 3: Yankees 5-Player Statcast Comparison
The first real-world exit velocity data for torpedo bat users came from the five New York Yankees players who adopted the bat heading into the 2025 season. Statcast tracking — which captures EV on every batted ball event — provides a direct before-and-after comparison across full seasons of at-bats.
| Player | 2024 Avg EV | 2025 Avg EV | Δ EV | Δ Bat Speed | Interpretation |
|---|---|---|---|---|---|
| Anthony Volpe | 86.2 mph | 89.5 mph | +3.3 mph | +3.0 mph | Largest individual gain; contact zone alignment |
| Jazz Chisholm Jr. | 89.8 mph | 91.0 mph | +1.2 mph | +1.1 mph | Power hitter — both levers contributing |
| Cody Bellinger | 87.5 mph | 89.2 mph | +1.7 mph | +2.5 mph | Strong gain; bat speed driving EV |
| Austin Wells | 87.1 mph | 88.5 mph | +1.4 mph | +2.0 mph | Consistent gain; both mechanisms |
| Paul Goldschmidt | 91.4 mph | 91.0 mph | -0.4 mph | +0.3 mph | EV flat; BA up 94 pts — contact quality gain |
Four of five players showed EV gains. The one exception — Paul Goldschmidt — is analytically important rather than a failure case. Goldschmidt's average EV declined by 0.4 mph while his batting average improved by 94 points (.245 to .339). This is consistent with the torpedo bat's contact quality improvement mechanism: he is not hitting the ball harder, he is hitting it better — making more of his contact events land in the high-efficiency zone rather than the tip zone. For Goldschmidt specifically, the torpedo bat improved his output without improving his raw EV, because the gain was in contact zone alignment, not in swing speed.
The Goldschmidt case is the cleanest evidence of the torpedo bat's second performance mechanism — collision efficiency improvement independent of bat speed. His EV stayed flat, his batting average jumped 94 points. The bat moved his contact quality, not his raw power.
Source 4: The 18-Player Statcast Study (Sportscasting, 2025)
The broadest available Statcast analysis of torpedo bat exit velocity comes from Sportscasting's comparison of 18 MLB players who adopted torpedo bats in 2025 versus their 2024 performance. This is the largest player sample in the published torpedo bat performance literature.
| Study Finding | Result | # Players | % of 18 | Context |
|---|---|---|---|---|
| Average EV gain (all 18) | +0.48 mph | 18 total | 100% | 2024 vs. 2025 season comparison |
| Players with EV improvement | 11 of 18 | 11 | 61% | Clear majority positive |
| Players with EV decline | 7 of 18 | 7 | 39% | Contact zone mismatch likely |
| Best individual EV gain | +3.3 mph (Volpe) | 1 | — | ~3.76% improvement |
| Largest EV decline | -1.8 mph (one player) | 1 | — | Likely tip-contact hitter |
| Hard-hit rate improvement (Volpe) | 35% → 48% (2024→2025) | 1 | — | 95+ mph threshold; .490 MLB BA at that speed |
| Avg EV gain (improvers only) | +1.4 mph (est.) | 11 | 61% | More meaningful for design-matched hitters |
Interpreting the 39% Who Declined
The 39% of players who showed EV declines in the 18-player study are not evidence that the torpedo bat fails — they are evidence that the torpedo bat's benefit is contact-zone-specific. Players whose natural contact zone does not match the torpedo's peak mass location will see EV decline at their typical contact points. Without knowing the contact zone profile of each of the 18 players, it is not possible to determine which declines reflect a genuine mismatch versus a swing adjustment period or sample variation. However, the directional signal is consistent: players with contact zones in the 5–8 inch range benefit; players who contact more toward the tip or who have adjusted contact patterns do not.
The Hard-Hit Rate Signal
Beyond average EV, the torpedo bat's performance shows up most clearly in hard-hit rate — the percentage of batted balls with exit velocity of 95 mph or higher. Volpe's hard-hit rate jumping from 35% to 48% year-over-year is the most dramatic individual signal in the dataset. At 95+ mph exit velocity, MLB batting average is approximately .490 — nearly double the league average. A 13-percentage-point hard-hit rate improvement is not a minor statistical noise — it is a fundamental change in contact quality that directly predicts better offensive outcomes.
Frequently Asked Questions: Torpedo Bat Exit Velocity
At the player's natural contact zone — yes, by 5–7% according to the Baseball Performance Lab barrel map, and by an average of +0.48 mph in the 18-player Statcast study. Four of five Yankees torpedo users showed EV gains of +1.2 to +3.3 mph. At the barrel tip, the torpedo produces 2–3% lower EV than a traditional bat. The net effect depends entirely on where the player's contact zone sits — for the 61% of studied users whose contact zone matched the torpedo's peak mass location, EV improved.
Nathan obtained actual diameter profiles from a real MLB player's conventional and torpedo bats and ran them through his ball-bat collision code. His simulation found: (1) the torpedo bat produces higher EV at the contact zone (5–8 inches from the tip) and lower EV at the barrel tip (0–3 inches); (2) the crossing point where the two EV curves intersect sits at approximately 5–6 inches from the tip; and (3) the torpedo bat's sweet spot width — the zone of high collision efficiency — is greater than the traditional bat's, which he described as a "non-trivial" and definite advantage.
Goldschmidt's average EV declined by 0.4 mph with a torpedo bat, while his batting average increased by 94 points. This is the clearest illustration of the torpedo bat's second performance mechanism — contact quality improvement independent of raw EV. The torpedo bat aligned Goldschmidt's contact zone with the bat's peak mass location, converting more of his typical contacts into high-efficiency ball-bat collisions. This shows up as a batting average gain rather than an EV gain — he's not hitting the ball harder, he's hitting it better more often.
Collision efficiency (q) is a ratio describing what fraction of the kinetic energy in the bat-ball collision is transferred into the ball. It depends on effective bat mass at the contact point and how close the contact is to the bat's vibration nodes. The torpedo bat raises collision efficiency at the contact zone by concentrating more mass there (increasing effective bat mass) and by shifting vibration nodes toward the contact zone (reducing energy lost to bat vibration). At the tip, both effects reverse — lower mass and nodes further away — lowering q there.
Hard-hit rate (percentage of batted balls at 95+ mph EV) is one of the most direct measures of how well the torpedo bat's contact zone improvement translates to real offensive output. Volpe's hard-hit rate increase from 35% to 48% represents the strongest individual signal in the available data. At 95+ mph exit velocity, MLB batting average is approximately .490 — nearly double the league average. A player who shifts more batted ball events above that threshold is fundamentally improving their offensive profile, not just their raw statistics.
Continue Exploring Torpedo Bat Performance
Gallery