Torpedo Bat Performance: The Complete Evidence Review
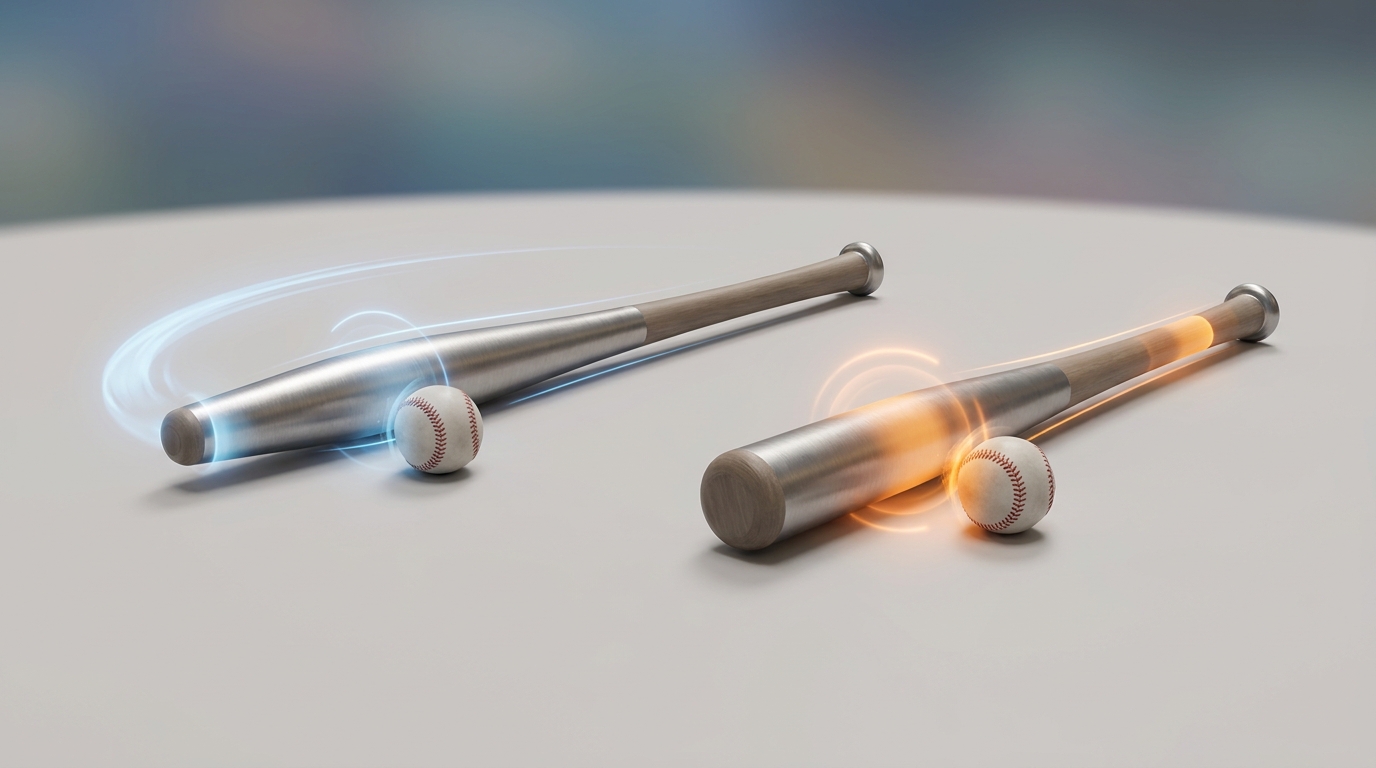
The torpedo bat made one of the most spectacular entrances in modern baseball history. Nine home runs on Opening Day 2025. A franchise record. Viral video of the bowling-pin barrel. But viral moments are not performance evidence — and the question that followed the spectacle was the right one: does the torpedo bat actually produce measurable performance gains, and how do we know?
This section compiles the complete performance evidence as of 2025 — the physics simulations, the lab barrel maps, the Statcast player studies, and the real-world numbers from the players who switched. The answer is not a simple yes or no. It is: yes, for most hitters at the contact zone; no, at the barrel tip; and it depends on the player's swing profile for everything in between. That nuance is exactly what makes the performance story worth understanding carefully.
61% of torpedo bat users in the first major player study showed exit velocity gains. 39% did not. The torpedo bat is a targeted tool — not a universal upgrade. This section tells you why, with the data behind it.
The Numbers at a Glance
Exit Velocity Gain (contact zone)
+5–7% vs. traditional Baseball Performance Lab barrel map — torpedo design outperforms by this margin at the player's natural contact zone18-Player Study Average EV Gain
+0.48 mph Sportscasting.com analysis (61% of users improved). Largest individual gain: Volpe +3.3 mphAverage Fly Ball Distance Gain
+8.3 feet ESPN Fantasy analysis of first 13 torpedo bat users — 314.4 ft avg → 322.7 ftHome Run Rate (HR/AB)
+16.6% average 55.5% of users saw significant HR/AB improvement — Schneeman led with +136.3%Hard-Hit Rate — Volpe (best case)
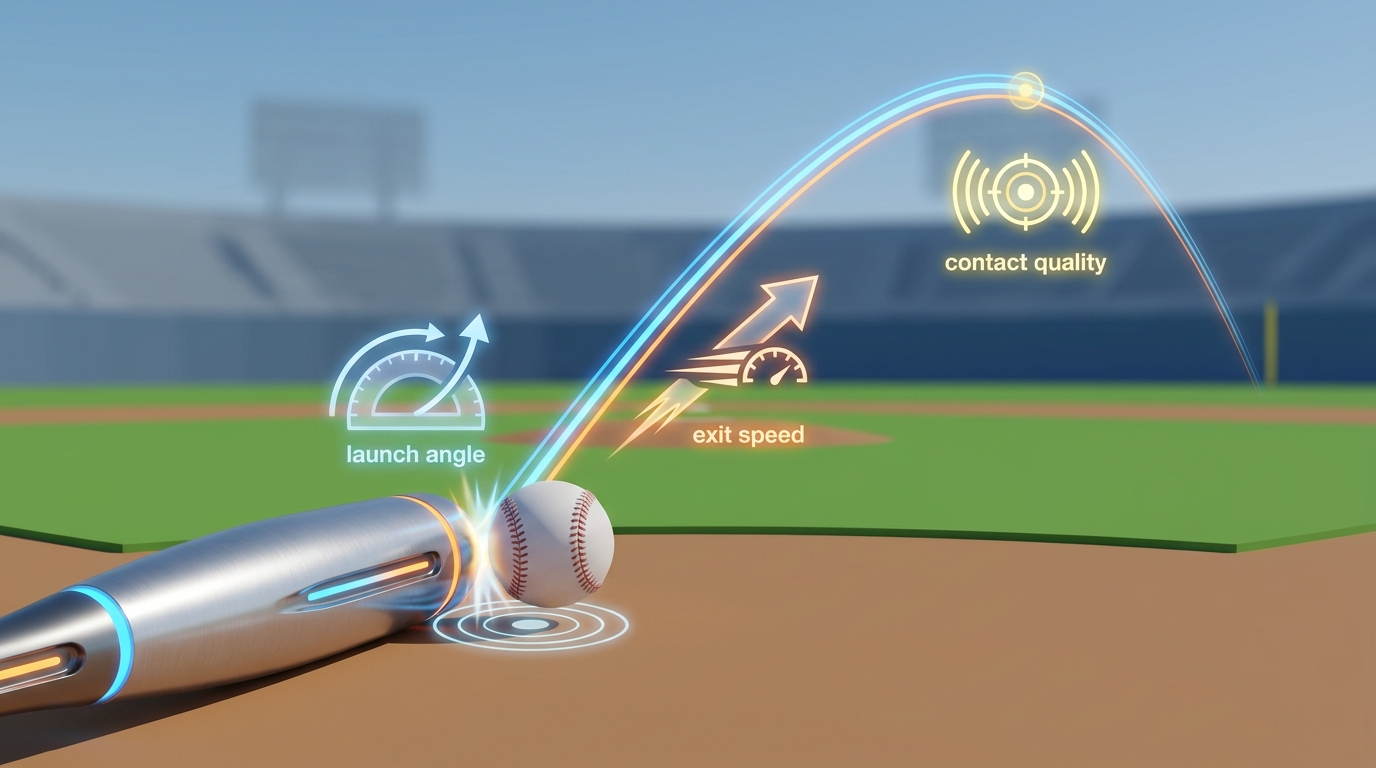
35% → 48% Hard-hit = 95+ mph EV. In 2024, 95+ mph balls had .490 MLB batting average vs. .218 belowUnderstanding the Evidence: Three Tiers of Performance Data
The performance data for the torpedo bat comes from multiple sources with meaningfully different levels of rigor. Understanding the tier structure is essential for interpreting the numbers correctly — and for not over- or under-weighting any single result.
| Tier | Evidence Type | Sources | Key Finding |
|---|---|---|---|
| Tier 1 | Physics simulation | Alan Nathan (U. Illinois), FanGraphs 2025 | 5–7% EV gain at contact zone; identical MOI possible |
| Tier 1 | Lab barrel mapping | Baseball Performance Lab | 5–7% more power at contact zone vs 2–3% gain on traditional tip |
| Tier 2 | Statcast player data (Yankees 5) | DRaysBay, Yahoo Sports, JMP analysis | All 5 players: bat speed ↑; range +0.3 to +3.0 mph |
| Tier 2 | 18-player Statcast study | Sportscasting.com (May 2025) | 61% EV gain (avg +0.48 mph); 55.5% HR/AB gain; mixed BA results |
| Tier 2 | 13-user ESPN group data | ESPN Fantasy (April 2025) | Slugging +84 pts; fly ball distance +8.3 ft; LA +3.2° |
| Tier 3 | Natural experiment (Montgomery) | Player anecdotal + Statcast | Broke traditional bat → EV dropped; torpedo restored → EV recovered |
| Tier 3 | Stanton 2024 postseason | ESPN, reported retroactively | 7 HR in 14 postseason games using torpedo secretly |
Tier 1 evidence — physics simulation and lab barrel mapping — is the most methodologically rigorous. It isolates the bat's effect from all player-level variables. Tier 2 evidence — Statcast player comparison studies — is real-world data but includes confounders: swing adjustments, pitcher quality, sample size, and seasonal variation all affect the results. Tier 3 evidence — natural experiments and anecdotal reports — provides directional signals but cannot be treated as causal proof. This section links to dedicated deep-dives for each tier. The full picture requires all three.
The Five Performance Dimensions: What the Data Shows for Each
| Performance Dimension | Data Source | Result Strength | Who Benefits Most | Who Benefits Least |
|---|---|---|---|---|
| Exit Velocity | Statcast + BPL lab | Strong at contact zone | Contact-zone hitters | Tip-heavy hitters |
| Ball Distance / Carry | Statcast + ESPN fly ball data | Indirect — via EV gain | Power hitters with contact zone alignment | Pure power; tip-contact |
| Batting Average | Sportscasting 18-player study | Variable — player-specific | Contact hitters (Goldschmidt type) | Power hitters adjusting timing |
| Home Run Rate | Sportscasting 18-player study | Positive — 55.5% improved | Moderate power with contact zone match | Elite power hitters (Judge profile) |
| Hard-Hit Rate | Statcast Hawk-Eye tracking | Strong positive (Volpe +13%) | Players whose contact zone matches design | Hitters needing swing adjustment |
| Bat Speed | Statcast bat tracking (2024→) | Consistent +1–3 mph (Yankees) | Lighter-bat preference hitters | Elite bat speed already (Stanton) |
The most important column in this table is the last two: who benefits most and who benefits least. The torpedo bat is not a universal improvement — it is a precision tool matched to a specific hitting profile. The performance evidence consistently shows the same pattern: players whose natural contact zone matches the torpedo's peak mass location see the largest gains. Players whose swing produces frequent tip contact or who have already-elite bat speed see smaller gains or no gains.
What Each Performance Page Covers
-
01 | Exit Velocity Tests
Lab barrel maps, Nathan's simulation, and Statcast player data — the most direct performance measurement.
📊 Deep dive: Torpedo Bat Exit Velocity Tests → -
02 | Distance Analysis
From exit velocity to carry — how torpedo bat EV gains translate to real distance, and when they don't.
📏 Deep dive: Torpedo Bat Distance Analysis → -
03 | Player Testing
Real-world performance data from the 18-player study, the Yankees 5, the Montgomery experiment, and Goldschmidt's case.
🧪 Deep dive: Torpedo Bat Player Testing → -
04 | Lab Methodology
How bat performance is actually measured — WSU Bat Lab, air cannon protocol, BBCOR, BBS, and what tests apply to wood torpedo bats.
🔬 Deep dive: Torpedo Bat Lab Methodology →
The Honest Performance Verdict: What the Evidence Actually Supports
The torpedo bat's performance case is strong but specific. Here is what the evidence actually supports, stated precisely:
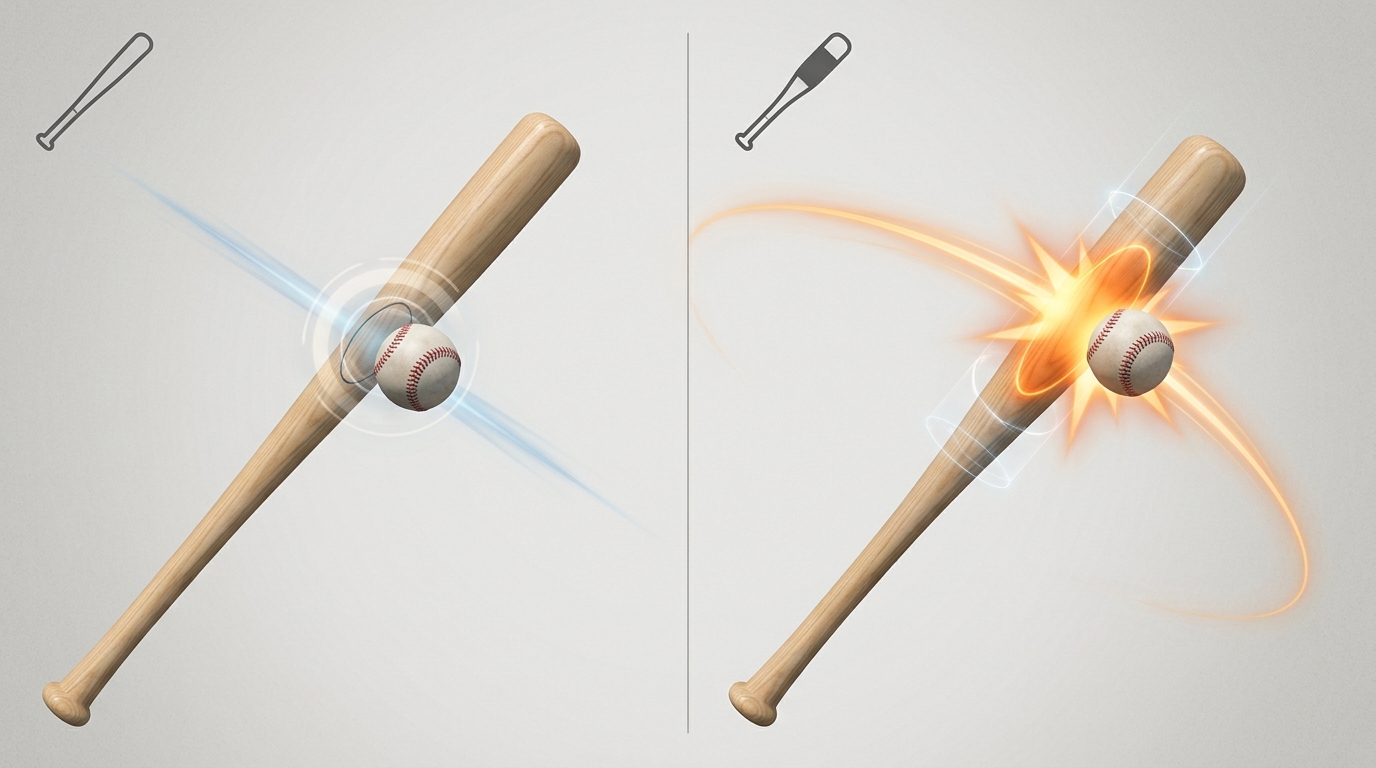
- EXIT VELOCITY at the contact zone: Strongly supported. The 5–7% gain at the contact zone relative to a traditional bat at the same location is supported by both physics simulation (Nathan) and lab barrel mapping (Baseball Performance Lab). This is Tier 1 evidence — the most reliable finding in the performance dataset.
- EXIT VELOCITY at the barrel tip: Negative. The traditional bat outperforms the torpedo by 2–3% at the very tip of the barrel. For players who frequently contact the tip, the torpedo bat may reduce performance. This is not suppressed in the evidence — it is part of Nathan's simulation results.
- BAT SPEED: Consistently positive across the Yankees sample. All five Yankees players showed bat speed gains of +0.3 to +3.0 mph year-over-year. The range of gains reflects that bat speed improvement depends on the player's starting MOI sensitivity — elite bat speed players gain less.
- HOME RUN RATE: Broadly positive, not universal. 55.5% of 18 players improved HR/AB, with an average +16.6% gain. 44.5% declined. This is a real, broad positive signal — but not a universal one.
- BATTING AVERAGE: Player-dependent, not reliably positive. 56% of 18 players saw batting average decline. The Goldschmidt case — BA up 94 points with EV down — shows the torpedo can improve contact quality without improving raw power. But it is not a batting average booster for everyone.
- DISTANCE: Indirectly positive via EV. The +8.3 foot average fly ball distance gain in the ESPN group is real, but it flows from exit velocity improvement — not from any direct aerodynamic advantage. The torpedo bat's distance gain is as consistent as its EV gain, nothing more.
Lloyd Smith (WSU Bat Lab): "If there is a competitive advantage with the torpedo bat, it's likely more due to an improved batting average than it is to an enhanced bat performance." This framing — accuracy over power — is the most defensible summary of what the evidence shows.
Who the Performance Evidence Says Benefits Most
Strong Performance Case
- Contact hitters whose natural contact zone is 6–8 inches from the barrel tip. This is the modal MLB contact zone — where the torpedo's peak mass lives. These hitters gain the most from the EV improvement at their actual contact location.
- Players with bat speed room to grow. Anthony Volpe (+3.0 mph) benefited far more than Paul Goldschmidt (+0.3 mph) from the MOI reduction. Lower bat speed entering the switch = more room for the MOI gain to produce improvement.
- Players in hitter-friendly environments. Jazz Chisholm Jr. at Yankee Stadium, with its short right-field porch — even a modest EV or launch angle improvement translates to home runs in that park that would be flyouts elsewhere.
Weaker Performance Case
- Elite bat speed hitters (Stanton, Judge profile). When a player is already swinging at 80+ mph, the MOI reduction produces minimal marginal bat speed gain. The performance benefit shifts entirely to the contact zone mass question — which only helps if their contact zone matches the torpedo's peak.
- Tip-contact hitters. Players who frequently battle inside pitches, get jammed, or fight off fastballs toward the end of the bat will hit in the torpedo's weaker zone. For these hitters, the design works against them.
- Players mid-swing-adjustment. Some early adopters who ditched torpedo bats mid-game were likely experiencing the timing adjustment that a new bat requires — not necessarily a fundamental mismatch. The performance evidence from the 18-player study reflects this adjustment period in the mixed results.
Frequently Asked Questions: Torpedo Bat Performance
At the player's natural contact zone — yes, by 5–7% according to the Baseball Performance Lab's barrel mapping. In an 18-player Statcast study, 61% of users saw average EV gains with an average improvement of +0.48 mph. The best individual case was Anthony Volpe at +3.3 mph. At the barrel tip, the torpedo underperforms a traditional bat by 2–3% — so the overall gain depends entirely on where the player makes contact.
In the most comprehensive player study available — Sportscasting's analysis of 18 MLB torpedo bat users in 2025 — 61% showed exit velocity gains, 55.5% showed home run rate improvement, and 44% showed batting average improvement. A group of 13 early adopters tracked by ESPN showed slugging +84 points and fly ball distance +8.3 feet. These are net-positive numbers, but they make clear that roughly one-third to one-half of users do not see performance gains in all categories.
Early adopters who abandoned torpedo bats mid-game reported feeling that the bat wasn't performing as expected. Several factors likely contributed: the contact zone adjustment period (the player's swing is calibrated to their previous bat's sweet spot location), the torpedo's reduced performance at the tip on jammed pitches, and simple psychological discomfort with an unfamiliar bat profile. The performance evidence suggests this adjustment period is real — some players who initially rejected torpedo bats returned to them after recalibrating their swing.
Primarily contact quality. Lloyd Smith of WSU's Bat Lab stated that if there's a competitive advantage, it's more likely to show in batting average than in bat performance (raw power). The Goldschmidt case is the clearest illustration: his EV declined slightly with the torpedo bat, but his batting average increased 94 points — because he was making contact more consistently. The torpedo bat helps hitters make more of their good swings into actual hits, not primarily by hitting the ball harder when they do make contact.
Reasonably well. Alan Nathan's physics simulation predicted EV gains at the contact zone and losses at the tip — which is exactly what the Baseball Performance Lab barrel map and the 18-player Statcast study confirmed. The magnitude of real-world gains (averaging +0.48 mph EV) is more modest than the theoretical maximum from the simulation, consistent with the expectation that not all players have perfectly matching contact zones and that swing adjustment effects dilute the initial results.
Explore the Full Performance Evidence
- 📊 Exit Velocity Tests: Lab Data and Statcast Results
- 📏 Distance Analysis: From EV Gains to Real Carry
- 🧪 Player Testing: The 18-Player Study and Case Analyses
- 🔬 Lab Methodology: How Bat Performance Is Actually Measured
Related: From the Technology and Science Series
Gallery