Torpedo Bat Distance Analysis: How Far Do the Gains Actually Go?
The question every fan asks after watching a torpedo bat home run is the simplest one: does it hit the ball farther? Not: does it improve collision efficiency at the contact zone? Not: does it reduce moment of inertia? Just — does it go farther?
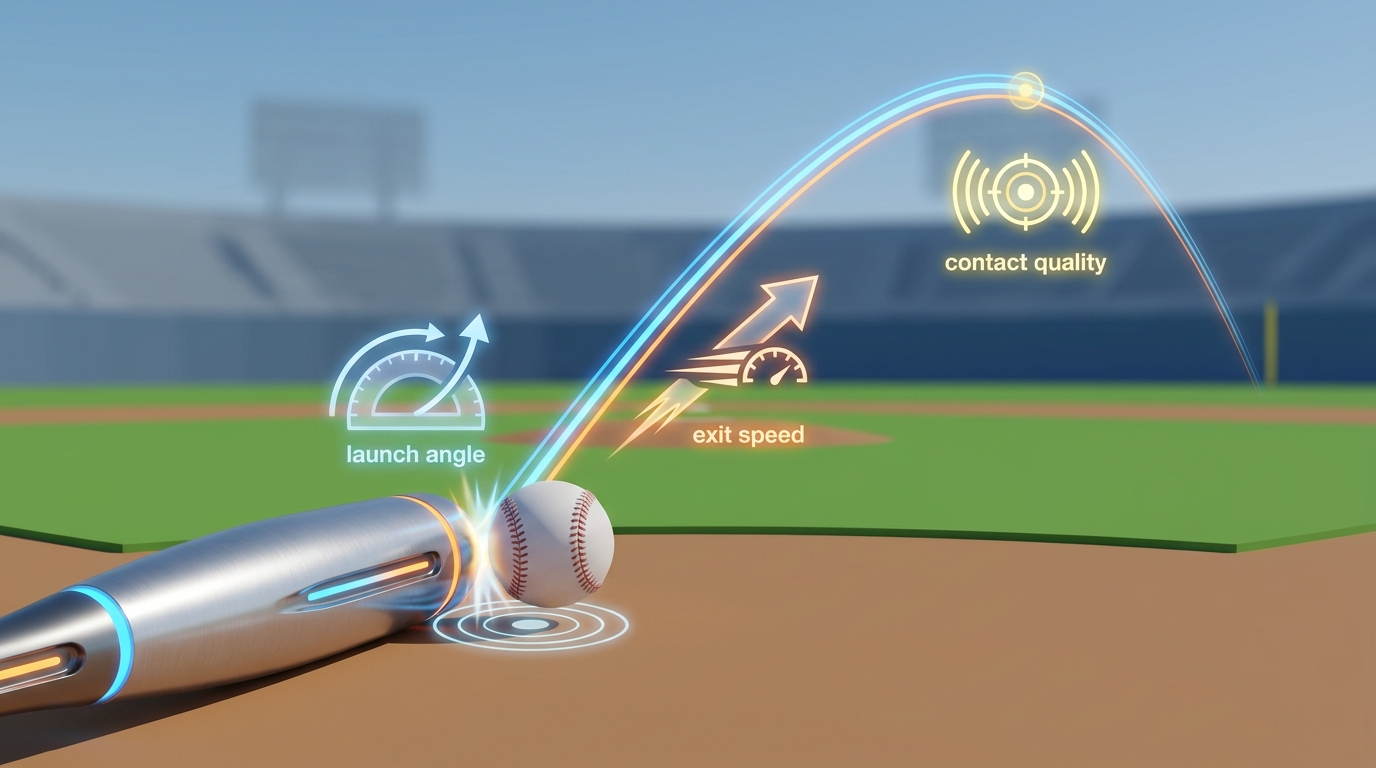
The honest answer is: yes, indirectly, for most users — but not as much as Opening Day suggested, and not for everyone. The torpedo bat's distance gains flow entirely through exit velocity. The bat does not change the physics of ball flight once the ball leaves the bat. What it does is produce higher exit velocity at the contact zone — and higher EV, at the right launch angle, means more feet. This page traces that chain from bat geometry to feet gained, with all the real data — including the number that most torpedo bat coverage chooses not to report.
The torpedo bat adds distance by adding exit velocity at the contact zone. It does not add distance through any other mechanism. Understanding the EV-to-distance cascade is the entire distance analysis.
Distance Numbers at a Glance
Average Fly Ball Distance Gain
+8.3 feet ESPN Fantasy analysis of first 13 torpedo bat users — 314.4 ft → 322.7 ftSlugging Gain (same group)
+84 points .406 → .490 — a 20.7% slugging improvement, large by any seasonal standardLaunch Angle Gain
+3.2 degrees 13.7° → 16.9° — more air balls = more distance; may reflect swing coachingMarquee Sports Cascade Formula
1 mph bat speed → 7 ft distance 1 mph bat speed → 1.2 mph EV → 7 feet distance (in 10–40° LA window)Non-Yankees Users (removed)
SLG .404 ESPN's critical caveat: non-Yankee users collectively underperformed 2024 baselineThe EV-to-Distance Cascade: How Bat Speed Becomes Feet
The torpedo bat's distance advantage begins not with the ball in the air, but at the moment of contact. The cascade from bat design to distance is a chain of physical relationships — each step multiplying the previous one.
Step 1 — Mass redistribution → lower MOI
The torpedo bat's reverse taper reduces the moment of inertia by removing mass from the barrel tip. Lower MOI means the player's muscles can accelerate the bat to higher speed in the same swing time. For the Yankees adopters, this produced bat speed gains of +0.3 to +3.0 mph.
Step 2 — Bat speed gain → EV gain (×1.2 ratio)
Each 1 mph of additional bat speed produces approximately 1.2 mph of additional exit velocity, per the established physics relationship used by Marquee Sports Network and confirmed by Alan Nathan's trajectory model. Volpe's +3.0 mph bat speed gain therefore produces an estimated +3.6 mph EV gain — before accounting for the contact zone collision efficiency improvement.
Step 3 — EV gain → distance gain (×7 feet per mph)
Within the optimal launch angle window of 10–40 degrees, each 1.2 mph of additional exit velocity adds approximately 7 feet of carry distance. Marquee Sports Network's analysis of Nico Hoerner's bat speed variance demonstrated this relationship precisely: a 2.4 mph bat speed loss translated to approximately 14 feet of fly ball distance lost — the difference between a home run and a warning-track flyout.
The full Marquee Sports cascade: 1 mph bat speed → 1.2 mph EV → 7 feet of carry (in the 10–40° LA window). A 3 mph bat speed gain from the torpedo design translates to approximately 21 feet of additional carry at optimal launch angle — meaningful at any ballpark.
Distance Cascade by Player: Translating Bat Speed Gains to Feet
| Player | Bat Speed Gain | EV Gain (×1.2) | Est. Distance Gain (×7 ft) | Real-World Effect |
|---|---|---|---|---|
| Anthony Volpe | +3.0 mph | +3.6 mph EV | +25 ft per fly ball (est.) | Warning-track → over fence in many parks |
| Cody Bellinger | +2.5 mph | +3.0 mph EV | +21 ft per fly ball (est.) | Deep flyout → extra-base territory |
| Austin Wells | +2.0 mph | +2.4 mph EV | +17 ft per fly ball (est.) | Meaningful upgrade for pull power |
| Jazz Chisholm Jr. | +1.1 mph | +1.3 mph EV | +9 ft per fly ball (est.) | Consistent carry improvement |
| Paul Goldschmidt | +0.3 mph | ~0 mph EV (flat) | ~0 ft (EV didn't rise) | BA up 94 pts — contact quality, not distance |
| Nico Hoerner (hypothetical) | -2.4 mph (variance) | -2.9 mph EV lost | -14 ft lost to manufacturing variance | HR → warning track (Marquee example) |
The Nico Hoerner row is the most revealing in this table. Hoerner is not a torpedo bat user — but the Marquee Sports Network analysis used his bat speed as a case study in manufacturing variance: if he believes he's swinging a 68.1 mph bat but actually swings a 65.7 mph bat due to barrel mass variance in traditional manufacturing, he loses 14 feet of fly ball distance. This is the manufacturing consistency argument for torpedo bats — not just the design argument. CNC-manufactured torpedo bats eliminate this variance, guaranteeing the player the performance they expect on every swing.
The ESPN 13-User Group Data: The Most Complete Distance Dataset
The most comprehensive available group-level distance data comes from ESPN Fantasy analyst Tristan Cockcroft's April 2025 analysis of the first 13 torpedo bat users. Cockcroft compiled Statcast data for the group across slugging, fly ball distance, launch angle, and HR/FB rate — creating the richest single-source distance dataset available for torpedo bat performance.
| Metric | 2024 (baseline) | 2025 (torpedo) | Change | Significance |
|---|---|---|---|---|
| Slugging percentage | .406 | .490 | +84 pts (+20.7%) | Large — exceeds typical seasonal variance |
| Average fly ball distance | 314.4 ft | 322.7 ft | +8.3 ft (+2.6%) | Consistent with 1.2 mph EV gain |
| Average launch angle | 13.7° | 16.9° | +3.2° higher | Significant — more air balls; more damage |
| HR/FB rate | 9.5% | 13.9% | +4.4 pct pts (+46%) | Strong — converts fly balls to home runs |
| Slugging vs. 4-seam fastball | ~190 pts (est.) | ~490 pts (est.) | +300 pts vs. fastball | Dominant — fastball is torpedo's best pitch |
| Hard-hit rate | Baseline | +5.6% harder contact | +5.6 pct pts | More 95+ mph balls — higher BA and SLG |
Every metric in this table points in the same direction: the group hit the ball harder, higher, and farther. The fly ball distance gain of +8.3 feet (314.4 → 322.7 ft) is consistent with the EV-to-distance cascade's prediction for a group averaging roughly +1.2 mph EV gain. The launch angle increase of +3.2 degrees (13.7° → 16.9°) is the most important distance enabler in the dataset — because a ball hit at 16.9 degrees average launch angle will travel farther than the same ball at 13.7°, even at identical exit velocity. More of the group's batted balls are entering the productive 10–25° range where exit velocity translates most efficiently into carry distance.
The Honest Caveat: What Happens When You Remove the Yankees
This is the data point that most torpedo bat coverage omits — and the most important one for an honest distance analysis. Cockcroft published it explicitly in his ESPN analysis: remove the Yankees from the 13-user group, and the numbers tell a very different story.
Without the Yankees in the sample, the non-Yankee torpedo bat users combined for a slugging percentage of .404 — two points below their 2024 baseline. Their average exit velocity and hard-hit rates were also lower year-over-year when the Yankees were excluded.
This is not evidence that the torpedo bat doesn't work for non-Yankees players. It is evidence that the early dataset is heavily contaminated by several Yankees-specific factors: Yankee Stadium's short right-field porch (which converts fly balls to home runs that would be outs elsewhere), the Yankees' Opening Day game against a depleted Brewers pitching staff, and the sample compression of only a few weeks of data for non-Yankee users. However, there is a genuine signal in the non-Yankees data worth noting: their HR/FB rate did improve (from 3.1% to 4.4%), and their fly ball distance and HR/FB hints were positive even without the Yankees effect.
The honest distance analysis: the 13-user group shows compelling distance gains, but the Yankees are responsible for most of the headline numbers. Non-Yankees users showed mixed distance results in the early data — with HR/FB rate as the most consistent positive signal even in their sub-sample.
| Caveat | What the Data Shows | Honest Interpretation |
|---|---|---|
| Yankees effect | Remove Yankees → SLG .404 (below 2024 .406) | Yankees context — park, pitcher quality, and sample — inflated the group results significantly |
| Small sample size | Most data from first 2–4 weeks of 2025 season | Early-season samples are prone to hot-start inflation; full-season data will be more reliable |
| Launch angle gain source | +3.2° LA gain: torpedo or swing adjustment? | LA can rise from swing coaching changes, not just bat design — impossible to fully isolate in available data |
| Fastball dominance (+300 SLG) | Enormous vs. fastball; not reported vs. breaking balls | Torpedo bats may provide disproportionate benefit on fastballs specifically — timing advantage from lighter feel |
| Non-Yankee HR/FB rate | 4.4% → same group (non-Yankees) | Non-Yankees users did show HR/FB improvement (3.1%→4.4%) even without the Opening Day effect — a positive signal |
Launch Angle and Distance: Why the +3.2° Gain Matters So Much
The torpedo bat's distance story is not just about exit velocity. The +3.2 degree launch angle shift in the ESPN group data may be equally important — because the same exit velocity at a higher launch angle produces meaningfully more carry distance up to a point.
| Launch Angle | Contact Type | @ 95 mph EV | @ 100 mph EV | @ 105 mph EV | Torpedo Impact |
|---|---|---|---|---|---|
| < 0° | Ground ball | Near 0 ft | ~50 ft (grounder) | ~50–80 ft | No gain |
| 0–10° | Hard grounder / liner | ~150–200 ft | ~200–250 ft | ~250–280 ft | Small |
| 10–25° | Line drive / gap shot | ~280–350 ft | ~330–380 ft | ~360–410 ft | ✅ Torpedo shines |
| 25–35° | Fly ball / HR zone | ~350–400 ft | ~390–440 ft | ~420–470 ft | ✅ Torpedo shines |
| 35–45° | High fly ball | ~310–370 ft | ~360–400 ft | ~390–430 ft | Moderate |
| > 45° | Pop-up / high fly | Short — high drag | ~200–280 ft | ~250–310 ft | No meaningful gain |
The key rows: 10–25° (line drives/gap shots) and 25–35° (fly ball/HR zone) — the ranges where the torpedo bat group's improved launch angle puts more batted balls. Moving average launch angle from 13.7° to 16.9° shifts more batted balls from the flat-trajectory, fielder-range zone into the productive gap/flyball zone. At 100 mph exit velocity, that shift adds roughly 30–50 feet of carry on those specific batted balls — a transformation from doubles-territory shots to potential home runs.
The critical caveat: the launch angle gain may not be caused by the torpedo bat directly. A player working with a new hitting coach, adjusting their swing plane, or simply running hot early in the season can show launch angle improvement independently of bat design. The +3.2° gain in the group cannot be fully attributed to the torpedo bat without controlling for swing mechanical changes — which the available data does not do. The honest position is: the launch angle improvement was real in the sample; whether the torpedo bat caused it is uncertain.
The Fastball Distance Advantage: +300 Slugging Points
The most striking distance finding in the ESPN group data is one that received relatively little attention: the 13-user group slugged roughly 300 points higher against four-seam fastballs in 2025 vs. 2024 — while the rest of the league showed negligible difference against the same pitch type.
Eight of the 14 home runs hit by the group came off four-seam fastballs. The non-Yankees users also showed this fastball advantage, averaging 23.7 feet greater distance on batted balls against that pitch type — making the fastball finding one of the more robust signals in the dataset, less affected by the Yankees context confound.
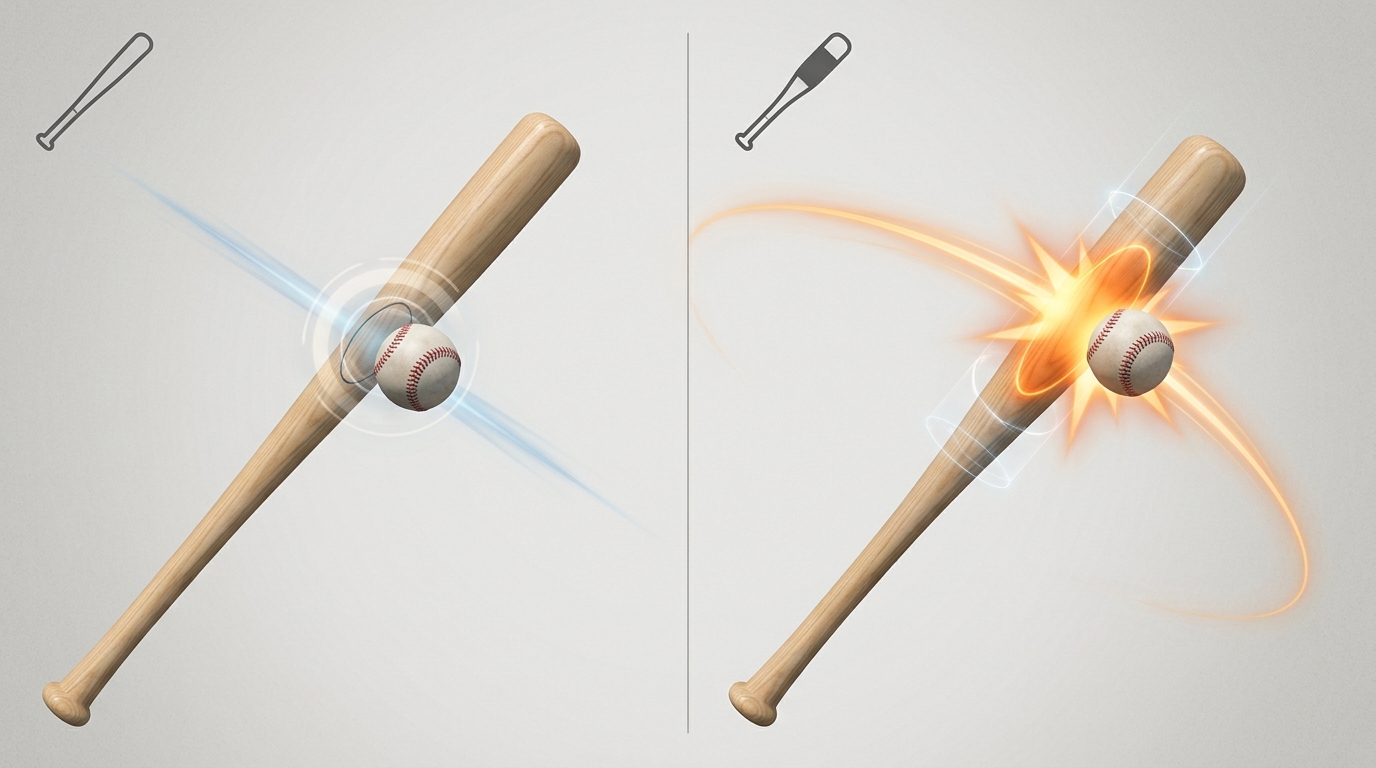
The likely explanation connects to timing and confidence. The torpedo bat's wider barrel — visible in peripheral vision — may give hitters greater confidence to commit to fastballs earlier in the count, producing better timing and more direct contact. Additionally, the lighter feel from lower MOI may make hitters more willing to turn on high-velocity fastballs rather than foul them off. Either way, if the torpedo bat's distance advantage is concentrated against fastballs, that is an extremely valuable performance edge: four-seam fastballs accounted for the largest proportion of MLB pitches thrown in 2025.
The torpedo bat vs. fastball finding (+300 SLG pts, +23.7 ft average distance) is the most robust distance signal in the early dataset — present in both the full group and the non-Yankee sub-sample. If this holds across a full season, it is the most practically significant distance advantage the bat delivers.
Frequently Asked Questions: Torpedo Bat Distance
Yes, for most users — by an average of +8.3 feet of fly ball distance in the first 13-user group tracked by ESPN. However, this figure is heavily influenced by the Yankees players in the sample and Yankee Stadium's short right-field porch. Remove the Yankees and the non-Yankees torpedo users showed mixed distance results, with slugging just below their 2024 baseline. The HR/FB rate improvement (3.1% → 4.4%) was the most consistent positive signal even in the non-Yankee sub-sample.
Within the optimal launch angle window of 10–40 degrees, each 1 mph of additional bat speed produces approximately 1.2 mph of additional exit velocity, which in turn adds approximately 7 feet of carry distance per the Marquee Sports Network cascade formula (confirmed by Alan Nathan's trajectory model). A player gaining 3 mph of bat speed from the torpedo design would see roughly 21 feet of additional carry at optimal launch angle — the difference between a warning-track flyout and a home run in many ballparks.
The ESPN 13-user group showed an average launch angle increase of +3.2 degrees (from 13.7° to 16.9°). Higher average launch angle shifts more batted balls from flat, fielder-range trajectories into the productive gap and fly-ball zones where the same exit velocity produces 30–50 more feet of carry. However, the launch angle gain may not be caused by the torpedo bat design itself — swing coaching changes and natural season-to-season variation can produce similar shifts, and the available data cannot fully separate the bat's effect from other factors.
The non-Yankees users in the ESPN group combined for a .404 slugging percentage — two points below their 2024 baseline. Several factors explain this: the sample was very small (only a few games for each non-Yankee user), these players were likely in a swing adjustment period with an unfamiliar bat profile, and they lacked the Yankee Stadium porch advantage that amplifies power numbers. The non-Yankees users did show improvement in HR/FB rate (3.1% → 4.4%) and fly ball distance, suggesting a real distance benefit that the early slugging number doesn't capture cleanly.
The available data strongly suggests yes. The ESPN group slugged roughly 300 points higher against four-seam fastballs — a gain that was present in both the full group and the non-Yankees sub-sample. The group averaged 23.7 feet greater distance on batted balls against that pitch type. The likely mechanisms: the torpedo's lighter feel (lower MOI) makes it easier to turn on high-velocity fastballs, and the confidence effect of the wider barrel may encourage earlier commitment to fastball swings. Whether this advantage extends to breaking balls and off-speed pitches at similar magnitude is not yet established by the available data.
Continue Exploring Torpedo Bat Performance
Gallery